Mac 系统提示错误

RuntimeException with message 'The exit status code '126' says something went wrong:
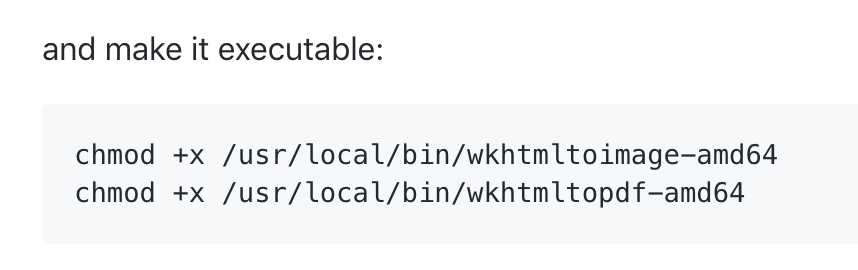
stderr: "sh: /Users/wangqinfeng/ctsy/trunk/vendor/h4cc/wkhtmltopdf-amd64/bin/wkhtmltopdf-amd64: cannot execute binary file
"
stdout: ""
command: /Users/wangqinfeng/ctsy/trunk/vendor/h4cc/wkhtmltopdf-amd64/bin/wkhtmltopdf-amd64 --lowquality 'http://api.water.local/welcome' 'topic-102.pdf'.'

《L05 电商实战》
从零开发一个电商项目,功能包括电商后台、商品 & SKU 管理、购物车、订单管理、支付宝支付、微信支付、订单退款流程、优惠券等
《L02 从零构建论坛系统》
以构建论坛项目 LaraBBS 为线索,展开对 Laravel 框架的全面学习。应用程序架构思路贴近 Laravel 框架的设计哲学。
讨论数量: 8
liyu001989

file

试一下。提示是不能执行,权限问题吧

5年前 评论
zhiheniunaibuhejiu 4年前
playmaker 3年前

@liyu001989 页面有JS的怎么样处理的?比如有百度图表的。

5年前 评论

@liyu001989 Object of class Barryvdh\Snappy\PdfWrapper could not be converted to string

return PDF::loadFile('http://api.water.local/archives/index')->save(time() . '.pdf');

5年前 评论
liyu001989

应该是页面什么样,pdf 就什么样。你的意思 js 渲染的图标,pdf 里面不正确吗?

描述一下具体的场景吧,截个图

5年前 评论
<!DOCTYPE html>
<html lang="zh-CN">
<head>
    <meta charset="utf-8">
    <meta http-equiv="X-UA-Compatible" content="IE=edge">
    <meta name="viewport" content="width=device-width, initial-scale=1">
    <!-- CSRF Token -->
    <meta name="csrf-token" content="6p1LhCvs6AOAgEFgxvbW0fObeM4wZ8UcMKo9XWhV">
    <title>环境监控(监测)运营监管平台</title>

    <style>
        body{
            background-color: #fff;
        }
    </style>
</head>
<body>

<div class="container">
    <h2 class="text-center mb-3">我是PDF标题</h2>

        <table class="table border border-dark bg-light">
            <thead class="thead-dark">
            <tr>
                <th scope="col">#</th>
                <th scope="col">First</th>
                <th scope="col">Last</th>
                <th scope="col">Handle</th>
            </tr>
            </thead>
            <tbody>
            <tr>
                <th scope="row">1</th>
                <td>Mark</td>
                <td>Otto</td>
                <td>@mdo</td>
            </tr>
            <tr>
                <th scope="row">2</th>
                <td>Jacob</td>
                <td>Thornton</td>
                <td>@fat</td>
            </tr>
            <tr>
                <th scope="row">3</th>
                <td>Larry</td>
                <td>the Bird</td>
                <td>@twitter</td>
            </tr>
            </tbody>
        </table>

    <div class="row">
        <div class="col">
              <div class="bg-light p-2 border" id="chart1" style="height: 300px">

              </div>
        </div>
        <div class="col">
            <div class="bg-light p-2 border" id="chart2" style="height: 300px">

            </div>
        </div>
    </div>

</div>

<script src="https://cdn.bootcss.com/echarts/4.1.0/echarts.min.js"></script>

<script>
    let chart1 = echarts.init(document.getElementById('chart1'));

    let option = {
        title: {
            text: '堆叠区域图'
        },
        tooltip : {
            trigger: 'axis',
            axisPointer: {
                type: 'cross',
                label: {
                    backgroundColor: '#6a7985'
                }
            }
        },
        grid: {
            left: '3%',
            right: '4%',
            bottom: '3%',
            containLabel: true
        },
        xAxis : [
            {
                type : 'category',
                boundaryGap : false,
                data : ['周一','周二','周三','周四','周五','周六','周日']
            }
        ],
        yAxis : [
            {
                type : 'value'
            }
        ],
        series : [
            {
                name:'邮件营销',
                type:'line',
                stack: '总量',
                areaStyle: {},
                data:[120, 132, 101, 134, 90, 230, 210]
            },
            {
                name:'联盟广告',
                type:'line',
                stack: '总量',
                areaStyle: {},
                data:[220, 182, 191, 234, 290, 330, 310]
            },
            {
                name:'视频广告',
                type:'line',
                stack: '总量',
                areaStyle: {},
                data:[150, 232, 201, 154, 190, 330, 410]
            },
            {
                name:'直接访问',
                type:'line',
                stack: '总量',
                areaStyle: {normal: {}},
                data:[320, 332, 301, 334, 390, 330, 320]
            },
            {
                name:'搜索引擎',
                type:'line',
                stack: '总量',
                label: {
                    normal: {
                        show: true,
                        position: 'top'
                    }
                },
                areaStyle: {normal: {}},
                data:[820, 932, 901, 934, 1290, 1330, 1320]
            }
        ]
    };

    chart1.setOption(option);
</script>

</body>
</html>
5年前 评论
liyu001989

是有问题,我有空了看一下,或许可以更新个视频

5年前 评论
wanghan 4年前
playmaker 3年前

@liyu001989 我网上看了一下
return PDF::loadView('pdf',[
'data'=>1
])
->setOption('enable-javascript', true)//启用JavaScript
->setOption('javascript-delay', 3000)//JavaScript延迟
->setOption('enable-smart-shrinking', true)//启用智能收缩
->setOption('no-stop-slow-scripts', false)//不停止慢速脚本
->inline('abc.pdf');

但是JS效果还是不出来的

5年前 评论
playmaker

解决了吗?同样的问题 windows linux 上都是

3年前 评论

讨论应以学习和精进为目的。请勿发布不友善或者负能量的内容,与人为善,比聪明更重要!